Payout Frequency Trends in Video Poker Across Licensed Jurisdictions

Video poker paytables in licensed jurisdictions reveal distinct patterns in payout frequency when analysts examine return-to-player percentages alongside hit rates for winning hands. Data from multiple regulatory bodies shows that games such as Jacks or Better and Deuces Wild produce measurable differences in how often smaller payouts occur versus rarer high-value outcomes. Observers note that these variations stem directly from paytable configurations that operators must submit for approval before deployment in regulated markets.
Core Elements of Paytable Structures
Paytable structures determine both the frequency of payouts and the overall return percentages because each hand category carries a fixed multiplier that affects expected value calculations. Researchers have tracked how a 9/6 Jacks or Better paytable yields a theoretical return near 99.5 percent while a 8/5 version drops closer to 97.3 percent according to aggregated figures from state monitoring systems. These differences arise because lower payouts on full houses and flushes reduce the rate at which moderate wins trigger during extended play sessions.
Frequency data further indicates that royal flush occurrences remain statistically stable across paytables at roughly once every 40,000 hands yet the distribution of lesser payouts shifts noticeably when operators adjust bonus multipliers. Analysts compiling records from Nevada facilities and Ontario gaming venues have observed that progressive jackpot versions extend the interval between major hits while increasing the volume of minor returns to maintain player engagement metrics.
Regional Data Comparisons
Reports issued by the Nevada Gaming Control Board document video poker performance across thousands of machines and show consistent hit frequencies between 44 and 47 percent for standard paytables during the first half of 2026. Similar compilations from the Alcohol and Gaming Commission of Ontario reveal comparable ranges yet note slightly higher frequencies for Deuces Wild variants due to wild card mechanics that convert more hands into winners.
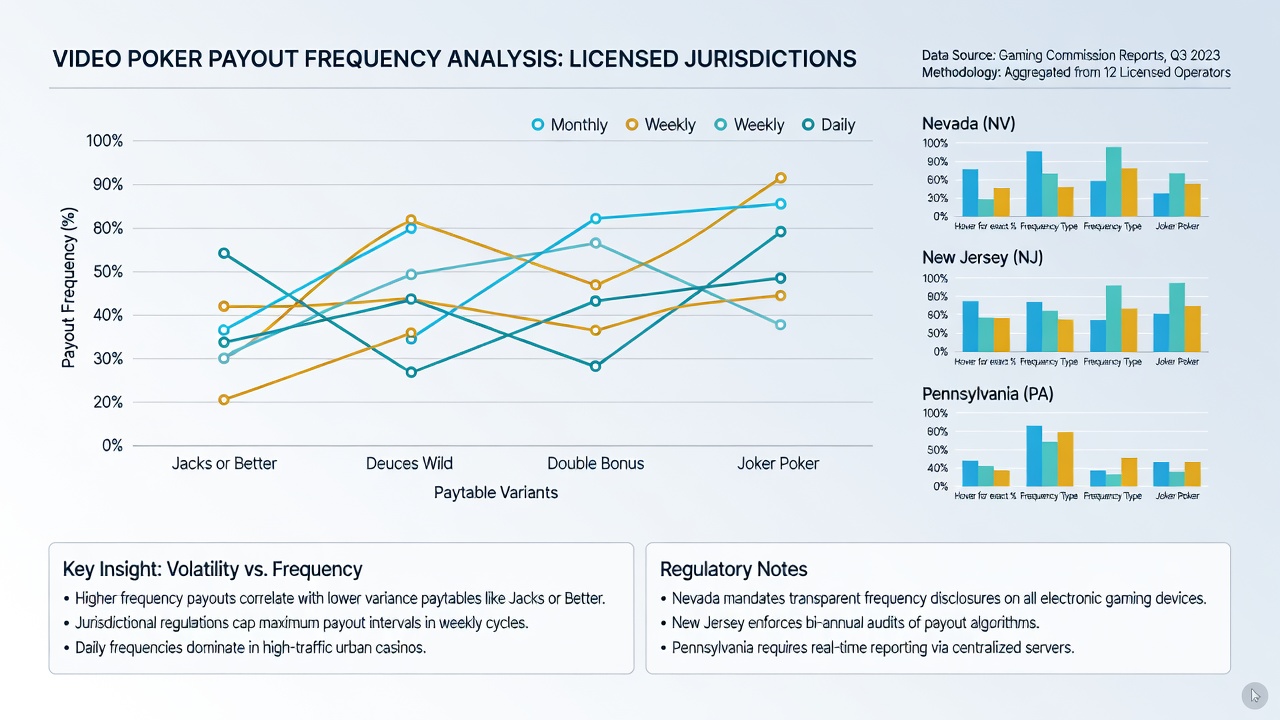
July 2026 updates from these sources highlighted incremental adjustments in machine configurations after operators responded to new minimum return thresholds introduced in late 2025. Data sets covering multi-state operations demonstrate that machines located in Atlantic City casinos maintain payout frequencies within one percentage point of Nevada averages when identical paytables operate under equivalent regulatory oversight.
Methodologies for Frequency Analysis
Analysts employ simulation software calibrated against actual machine logs to project payout intervals over millions of hands and then validate those projections against monthly activity summaries submitted to licensing authorities. This approach allows identification of paytable versions that cluster wins more tightly versus those that space them farther apart while preserving the same theoretical return.
Cross-jurisdictional studies further compare frequency distributions by isolating variables such as denomination and game variant. Figures compiled from multiple markets indicate that nickel machines often display marginally higher hit rates than dollar denominations because operators calibrate lower-denomination units to encourage longer sessions through more frequent small returns.
Implications for Licensed Operations
Operators in licensed jurisdictions must balance payout frequency against regulatory minimums and revenue targets because authorities review machine performance data during renewal processes. Records show that paytables producing payout intervals exceeding certain thresholds face additional scrutiny even when overall returns meet statutory requirements. Those who monitor these metrics note that adjustments to bonus round triggers can shift frequency curves without altering base game mathematics.
Conclusion
Comprehensive examination of payout frequency data across video poker paytables in licensed jurisdictions demonstrates clear linkages between paytable design, regulatory oversight, and observed win distributions. Continued collection of performance statistics from diverse markets supplies the raw material for refined models that predict how configuration changes affect both short-term hit rates and long-term return stability.