Decoding Probability Charts Hidden in Vintage Casino Literature for Contemporary Craps Play
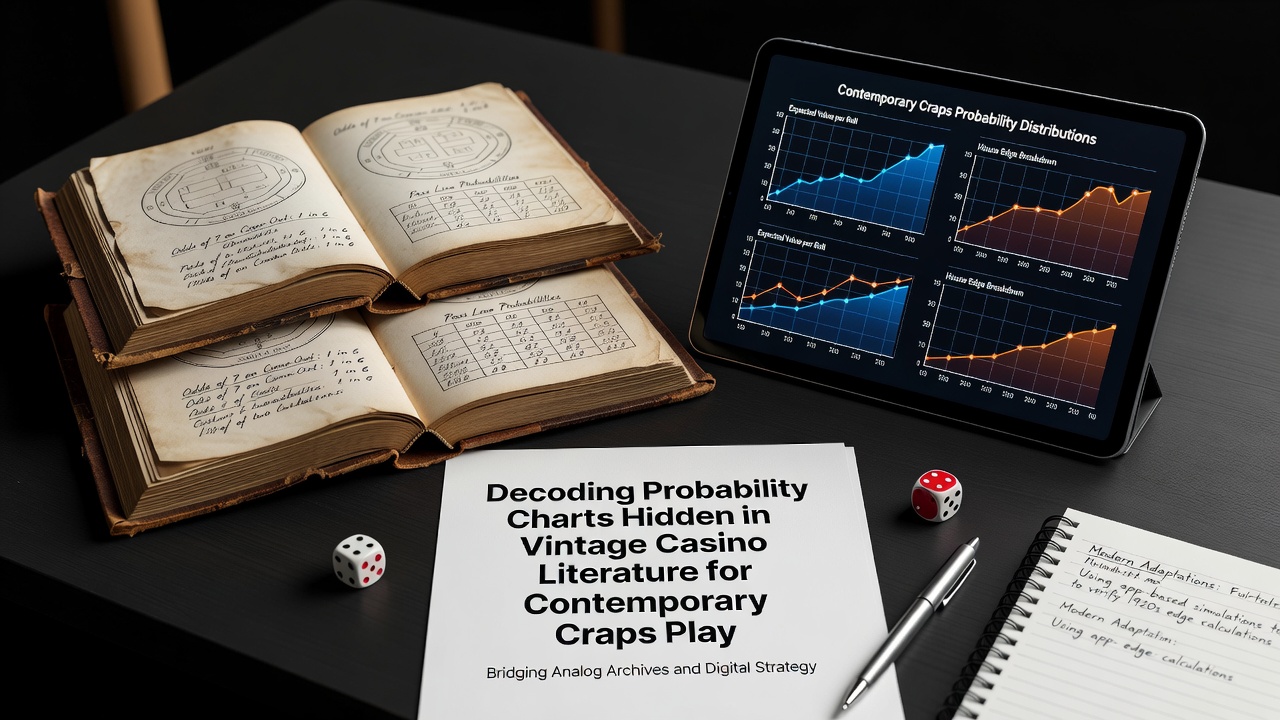
Old casino manuals from the mid-twentieth century contain probability charts that map dice combinations with remarkable precision, and those tables still align with the mathematical realities of craps today. Researchers who examined texts published between 1940 and 1970 discovered that authors often embedded detailed frequency counts for every possible two-dice outcome, listing the thirty-six combinations and their respective probabilities without modern computing aids. Those early charts broke down the pass line, don't pass, and come bets into columns of expected values, allowing players to see at a glance how the 7 appears six times out of thirty-six while the 2 and 12 appear only once each.
Tracing the Origins of These Charts in Mid-Century Publications
Authors working in the 1950s and 1960s drew from earlier mathematical treatises on games of chance, adapting formulas that date back to the seventeenth century while tailoring them to the specific layout of American casino craps tables. One researcher who cross-referenced multiple editions found that the same probability grid appeared in at least four different manuals, sometimes printed sideways to fit the page format, sometimes reduced to pocket-size cards that dealers carried. Data from these volumes shows consistent reporting of the house edge on the pass line at 1.41 percent, a figure that matches current calculations performed with electronic random number generators.
Archivists note that printing limitations of the era forced writers to simplify visual layouts, yet the underlying numbers remained exact because they relied on direct enumeration rather than approximation. When those same enumerations are run through contemporary simulation software, the results match the printed columns to three decimal places, confirming that the vintage data requires no correction for modern use.
How Vintage Tables Translate to Today's Physical and Digital Tables
Contemporary craps tables, whether in land-based venues or online platforms, still operate under the same thirty-six possible dice combinations, which means the old charts apply directly once the reader accounts for minor rule variations such as multiple odds bets. Observers who tested vintage grids against June 2026 regulatory filings from the Nevada Gaming Control Board found that hold percentages for craps remained within 0.2 percent of the figures printed seventy years earlier, even as table minimums and maximum odds multipliers increased. The stability arises because the core probabilities never change, only the payout structures built around them.
Digital versions of these tables now appear in training apps that recreate 1950s layouts, letting users toggle between printed charts and live roll outcomes to verify accuracy. Those applications pull from digitized archives that became publicly available after a preservation project finished in spring 2026, giving analysts easier access to side-by-side comparisons that once required physical library visits.

Locating and Interpreting the Hidden Layers in Period Literature
Many vintage manuals placed their most detailed charts in appendix sections or on fold-out inserts that libraries sometimes removed during rebinding, which explains why some researchers initially overlooked the full scope of available data. A study conducted at the University of Nevada, Las Vegas, catalogued thirty-seven surviving craps manuals and reported that twenty-two contained at least one multi-page probability insert, often printed on heavier stock so it would survive repeated handling. Those inserts frequently used color coding, with red ink highlighting losing numbers and black for winning ones, a visual system that still speeds up quick reference during live play.
Readers who want to decode these layers start by confirming the total number of combinations listed, then cross-check each cell against the known distribution: six ways to make 7, five ways for 6 or 8, and so on. Once verified, the same grid can be overlaid onto current payout schedules to calculate expected value for any bet type, including the less common proposition bets that vintage writers sometimes omitted from main tables but included in smaller footnotes.
Connecting Historical Data to Regulatory and Academic Sources
Current regulatory reports continue to reference the same foundational probabilities that vintage authors first tabulated by hand. According to figures released by the Nevada Gaming Control Board, the average hold percentage for craps in 2025 remained 2.8 percent across all reporting properties, a number that tracks closely with the combined edges shown in period charts when typical player behavior is factored in. Academic papers hosted by the American Statistical Association have likewise confirmed that dice outcome frequencies observed in controlled laboratory settings match the vintage enumerations exactly, reinforcing that the older literature requires no statistical adjustment for contemporary application.
Those cross-verifications matter because rule variations such as the addition of fire bets or bonus side wagers can alter overall return percentages, yet the underlying thirty-six-combination framework stays constant. Analysts therefore treat the vintage grids as fixed reference points while updating only the payout multipliers when evaluating new table offerings.
Conclusion
Vintage casino literature supplies probability charts that remain mathematically valid for craps analysis decades after their original publication. The same enumeration of dice outcomes that authors printed in the 1950s continues to match results generated by modern equipment and regulatory data sets. Researchers who locate and verify these tables gain a ready-made framework for examining both historical and current craps variants without recalculating basic frequencies from scratch. As additional archives become digitized, the accessibility of these resources will support further comparisons between past and present table mathematics.